2013/10/03: TrendView VIDEO Analysis: Equities, Fixed, FX
© 2013 ROHR International, Inc. All International rights reserved.
VIDEO ANALYSIS & OUTLOOK: Thursday, October 3, 2013.
EQUITIES & FIXED INCOME
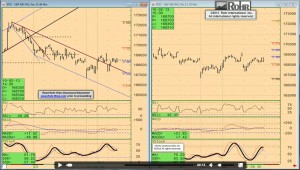
While the TrendView Videos are from earlier this morning, they remain very relevant for the trend decisions into later on today and likely even into Friday. The timeline of the Equities and Fixed Income video opens with some of the macro (i.e. fundamental) considerations and typical short-term and intermediate-term view of the S&P 500 future from, shifts to the other equities from 05:50, with govvies analysis beginning at 10:10, and short money forwards from 17:05 with a brief return to the S&P 500 future at 20:15.
FOREIGN EXCHANGE Analysis and Outlook below.
VIDEO ANALYSIS & OUTLOOK: Thursday, October 3, 2013.
FOREIGN EXCHANGE
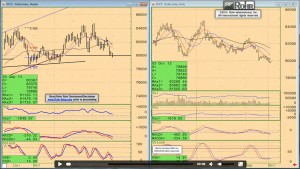
The Foreign Exchange video timeline opens with a brief mention of macro factors as well, moving on to the US Dollar Index at 03:30, then Europe at 06:00, Asia at 08:30, and analysis of the cross-rates at 13:10 prior to a brief return to the US Dollar Index at 16:45.
General Market Observations
▪ The video analysis highlights the macro-technical aspect of where the slide in the December S&P 500 future was more critical into the 1,682-78 area. And now that it gapped below it yesterday, a recovery back up above the 1,684 area is likely necessary to reflect any reversal of the recent down trend. 1,682 was the Close on Friday the 13th that turned out to be more bad luck for equities bears than bulls, as over that weekend was the Larry Summers’ withdrawal from the race for next Fed Chairman.
And the psychology which was exacerbated that week’s FOMC ‘No Taper’ Surprise was only a radical extension of the major accommodative psychology that caused the Monday morning gap higher (i.e. on weekly charts as well) generated by Summers’ announcement. As such, December S&P 500 future back below 1,682 is turning that ostensible UP Runaway Gap into an Exhaustion Gap top (this is the normal inference when Runaway gaps are overrun in the opposite direction.) The implication is that Fed QE is far less a determinant of the strength of the economy and equities! And along with weaker data that should be weighing on the equities. Except for the fact that for all the disappointment in some quarters with the lack of any Fed QE tapering, it appears Bernanke & Co. were at least partially justified in their fears.
That notwithstanding, unless the December S&P 500 future can indeed sustain activity back above the mid-1,690s once again sometime soon, lower supports like the mid-1,640s or even another test of 1,630-25 is possible. Of course, that would still be in the context of a broader up trend as long as that lower support holds.
EXTENDED TREND IMPLICATIONS
▪ As important is the return to more counterpoint in the equities and govvies trends after the FOMC Surprise mutual explosion. That is the classical tendency, and December T-note future that had dropped so much further than the Gilt and especially the Bund in mid-June, has traded back up above key failed congestion and major Fibonacci support in the 126-00 area. As it happens, there is extended resistance on the lead contract (still September at the time) chart anywhere up into the 127-00/-10 area as well. So proper assessment of that split resistance likely requires a clear idea of how the equities decision is proceeding below the key support noted above.
Similarly the previously stronger December Bund future that had played downside ‘catch up’ in the wake of the (typically early) September contract expiration early last month managed to rally back above its 138.41 violated major lead contract low from September 2012. Once it was above it again, the weakness of the equities also encouraged it to exceed extended resistance 139.60 and 140.10-.30 areas; with extended resistance up into 141.00-.30 area.
As is the case for weak sister December Gilt future that has been suffering under the perspective from the upbeat last set of BoE minutes and discount in December future (lead contract after September expired last Thursday.) Even with the extended influence of the continued US QE, it has initially just rallied back above the 119.15 violated major Fibonacci and congestion support. Yet after escaping that and further resistance in the upper-109.00 to low-110.00 area (congestion and violated Fibonacci supports), its next resistance is up into the hefty recent and historic congestion in the 111.30-.75 range.
▪ The foreign exchange remains more of a muddle, yet where the weakness of equities has weighed on the US Dollar Index in a manner that only occurs for the most part when the US is the source of the problem… like now!! After a ‘dead cat’ bounce from our long-anticipated test of the .8000 area in the wake of the FOMC Surprise, it is right back down retesting it today. That neither makes it a runaway bear nor gives any signal of a trend reversal. As we noted previous, it is reasonable to believe other currencies might continue to strengthen as long as the US budgetary problems are a stressor.
And that may be for quite a while, because it seems that the right wing Republicans are in a ‘right-makes-might’ trance in their populist echo chamber. Especially note the EUR/USD slippage held well into the 1.3500-1.4350 area (next support 1.3350-00), and the GBP/USD temporary easing back into 1.6000-1.5950 (next support 1.5750-00) has yielded to
AUD/USD was also back down slightly below violated resistance in the .9350-00 area after testing .9500 resistance on FOMC Surprise US dollar weakness, yet held very well at the top of the more critical .9280-40 Fibonacci and UP Break support. The Japanese yen signaled strength on USD/JPY slipping below 98.80 once again (even if that is very much a trading range affair of late.) There is much more discussion of the dynamic of the equities, fixed income and foreign exchange that includes review of the cross rates and specific technical indications in the end of week videos from last week (with links in yesterday’s Weekly Calendar email and posted in Rohr-Blog yesterday morning.)
The balance remains much the same as last week’s Current Rohr Technical Projections – Key Levels & Select Comments available via the link near the top of the right-hand column. Those will be updated after the US Close today in preparation for what may be a very interesting finish this week if there is no CR compromise.
Thanks for your interest.
p.s. As we are just back to blogging after a lengthy hiatus, some of the information on the blog is a bit dated. We will be clearing that up soon, and all of the current critical information (Calendar, Perspective, Technical Projections) is up to date.
Rohr's Website
